Digisonde
Directogram
1. Multi-beam Ionospheric Sounding and Real Time Drift
DPS digisonde can operate in the multi-beam sounding mode using six digitally synthesized off-vertical reception beams in addition to the vertical beam, as shown in Figure 1. For each frequency and height on a multi-beam ionogram, the raw data from the four receive antennas are collected and processed to form seven beams , separately for the O-mode and X-mode echoes. For each frequency-range pixel, the beam with the maximum amplitude is selected, and the amplitude and beam numbers are recorded in the output data.
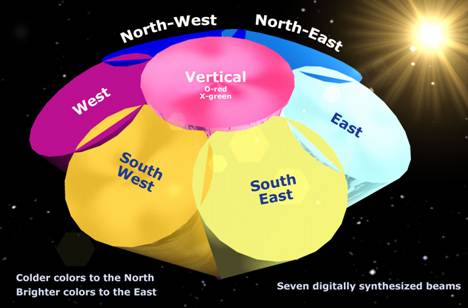
Figure 1. Multi-beam sounding by digisonde with the standard 4 antenna Rx system
Previously, the “BEM” format of binary ionograms had the maximum number of stored heights restricted to 128 and did not allow multi-beam processing of X-polarization data. A new digisonde ionogram format has been developed, “Routine Scientific Format” (RSF), that contains complete amplitude, Doppler, direction, and beam phase information for each combination of polarization, frequency, and height. The supporting software for data display and analysis, SAO Explorer and View2GIF, has been updated to support the new RSF format. The sample RSF ionogram from Boa Vista, Brazil, in Figure 2 shows the detailed structure including the reflections from a nearby bubble.
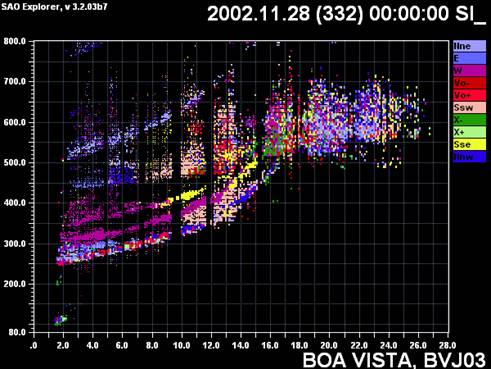
Figure 2. Sample RSF ionogram taken during disturbed ionospheric conditions at Boa Vista, Brazil
2. Directogram
To
slow the time history of large-scale plasma irregularities as they drift across
digisonde location, the “directogram” software was developed that processes the
multibeam ionograms. It uses RSF
ionogram data to derive ground distances to the plasma structures responsible
for the oblique echoes in the ionograms and then to plot them using direction,
Doppler, and amplitude information of the echoes. The Figure 3 presents a
sample directogram plotted by SAO Explorer using RSF ionograms collected during
24 hours from 12 UT Oct. 10 to 12 UT Oct 11, 2002 at
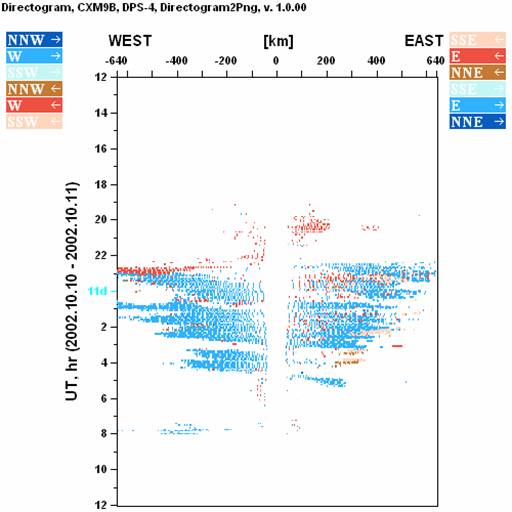
Figure 3. Sample directogram for Cachimbo station from
12 UT Oct 10 to 12 UT Oct 11, 2002. Blue color means ionospheric motion from
west to east.
Figure 4 illustrates the calculation of the ground distance to the reflection point that is plotted along the horizonal axis on the directograms. Ground distance to the reflection point, Di, is calculated individually for each oblique echo range Hi corresponding to a plasma structure:
![]()
where Hv is a representative vertical height of the F-layer that is estimated from the ionogram by locating the section of the vertical incidence F-trace where amplitudes are big and height gradient is low. When a manually scaled trace is available, hminF can be used reliably as Hv. For the autoscaled data, more consistent results are obtained by calculating summary amplitudes for all frequencies of vertical echo for each ionogram height and selecting hv as the height of the biggest amplitude.
Figure 4. Distance to the reflection point, Di, obtained from the representative height of the layer, Hv, estimated from the vertical trace on the ionogram, and oblique echo range, Hi, for each plasma structure
3. DRG file format
Information about directions and distances of oblique echoes can be stored in DRG file. One DRG record can be created from one ionogram. Each record contains 14 lines of information. The following is explanation for every line.
1. DRG Version1 StationID TimeStamp (year, month, day, hour, min, sec)
Example: DRG V1 062 20030908091200
2. Ionogram preface (see SAO format preface explanation)
Example: FF200325109080912000620624301000010009000000101107602000090501280000810040000
3. Base (vertical echo) height, [km]
Example: 245.0
4.
Height step, [km]
Example: 5.00
5. Total west signals above 0, [count]
Example: 22
6.
West distances list, [km]
Example: 49, 70, 100, 113, 124, 135, 145, 205, 213, 228, 235, 242, 249, 256, 263, 270, 277, 283, 290, 296, 303, 309
7. West amplitudes list, linear average [db]
Example: 21, 40, 31, 31, 33, 35, 24, 24, 15, 18, 18, 15, 21, 30, 12, 18, 24, 18, 24, 18, 21, 25
8. West directions list, [contra clockwise index]
Example: 2, 2, 2, 2, 4, 2, 2, 4, 2, 6, 2, 6, 2, 4, 2, 2, 6, 2, 4, 4, 2, 2
9. West doppler list, [index, same likes in SAO record]
Example: 3, 4, 3, 4, 3, 4, 3, 3, 3, 2, 3, 3, 3, 3, 3, 3, 3, 3, 3, 3, 3, 3
10. Total east signals above 0, [count]
Example: 25
11.
East distances list, [km]
Example: 49, 70, 87, 100, 113, 124, 135, 145, 155, 164, 173, 181, 189, 197, 213, 221, 228, 242, 249, 256, 263, 277, 283, 290, 296
12. East amplitudes list, linear average [db]
Example: 30, 18, 32, 27, 33, 30, 31, 33, 32, 35, 30, 35, 15, 30, 33, 34, 29, 31, 27, 24, 22, 18, 12, 12, 9
13. East directions list, [contra clockwise index]
Example: 12, 12, 12, 12, 12, 12, 12, 12, 12, 12, 12, 12, 12, 8, 8, 12, 10, 12, 10, 10, 10, 10, 10, 10, 12
14. East doppler list, [index, same likes in SAO record]
Example: 3, 4, 3, 3, 3, 3, 3, 3, 4, 3, 3, 3, 3, 3, 3, 3, 3, 3, 3, 3, 3, 2, 2, 2, 3
DRG file can contain many individual records.